
Coinvexity 2
Coinvexity 2
As macro risks compound with looming rate hikes and geopolitical tension in Ukraine, in this 2nd issue we cover options strategies, DOVs and the relation between liquidity, returns and patterns.


First off, we wanted to thank everyone who subscribed and the overall positive feedback on the newsletter. We’re also very excited to announce that 52k Skew has joined Coinvexity as a core contributor. Many of you know him on Twitter for his top notch insights on crypto derivs, so make sure to keep an eye out for some upcoming alpha!
Intro
@SousChef
Perhaps it’s just me but I’m beginning to feel a certain Stockholm syndrome setting in as we bumble around the 30k-40k region. It’s a strangely comforting sensation brought about by the fact we’ve already suffered a fantastic drawdown, combined with hopium that we don’t wake up to a presser declaring another dozen further rate hikes because printer went a little too brrrr. (I promise these are technical terms).
In response to the gyrations of the market, our extremely capable dev team have been hard at work conjuring up all sorts of machinations to help analyse and decipher price action. One treat I would like to bring to light is the ability to drill down and really pick apart strategy types thereby understanding market sentiment and forming a granular view of positioning.

This piqued my interest and so as an exercise I looked a little deeper into blocked Put strategies, pulling up the strategy volume tab and digging in to see trade composition. I began by filtering for the most popular expiry date traded within the week, 25 March. Interestingly Bull Put Spreads heavily outweigh their Bearish counterpart. There seems to be one 36k/20k Bear Spread (Fig 3 & 4.) vs a string of Bull spreads with a range of strikes beginning 40k all the way down to 22k. (Fig. 5)


This poses an interesting contrast when you consider how elevated Put vols are, and whether you would rather be a buyer or seller at these levels. And assuming you were to play a side, how would you go about managing risk, would these be outright exposures, or would you remain directionally neutral? This is a topic we covered in an earlier article which can be found here.

As I’ve hopefully conveyed in the preceding charts and paragraphs, Laevitas is a powerful tool that grants any user the ability to take in an elevated view of the playing field and then drill down into granular detail, hopefully aiding in strategy formulation and shedding light on previously shrouded areas.
Should you need a hand on finding or deciphering any of the mentioned tools please reach out to the team and we’ll be more than happy to guide you through the platform. For further discussion on any topics mentioned above, feel free to contact me on Telegram @foreignative.
DOVs as a Brake Pedal
As TVL has picked up, there has been much buzz around the suppression of implied vol due to regularly scheduled auctions by DeFi option vaults, which sell large amounts of low delta one week covered calls and cash-secured puts every Friday around 8am UTC. These vaults are available for many coins but are largest for Ethereum. The impact is substantial, and there is a great overview from Friktion here.
The chart below is theirs:

Friktion actually estimates this suppression of implied vol (essentially slippage) is costing depositors up to 30% APY! But there is a perhaps more interesting, less obvious effect from this fresh supply of options into the market on realized vol.
Traders on the other side of these sold options are exclusively market makers. Namely, QCP Capital takes down the majority of the auctions. Of course, QCP is not necessarily interested in just buying vol. They are more interested in buying these options for slightly less than they are truly worth, and hedging out risks over the life of the options in order to come away with a positive edge over time. Depositors are bettors, market makers are the house.

Deposits and strikes for the two largest DOVs this week
A good overview of the P/L for these option vault strategies can be found in this thread.
To stay directionally neutral and not be stuck nakedly long or short Ethereum, market makers long these options will have to buy/sell futures in amounts equivalent to the directional exposure of the options they hold (the delta). The delta of the options will change as the option becomes more/less likely to expire in the money.
Using the Black-Scholes formula, we can estimate the total deltas of the DeFi vault options at different prices, and thus the futures inventory of market makers. The effect here is a dampening one - as Ethereum rallies, market makers will have to sell futures, and as Ethereum sells off, market makers will have to buy futures:
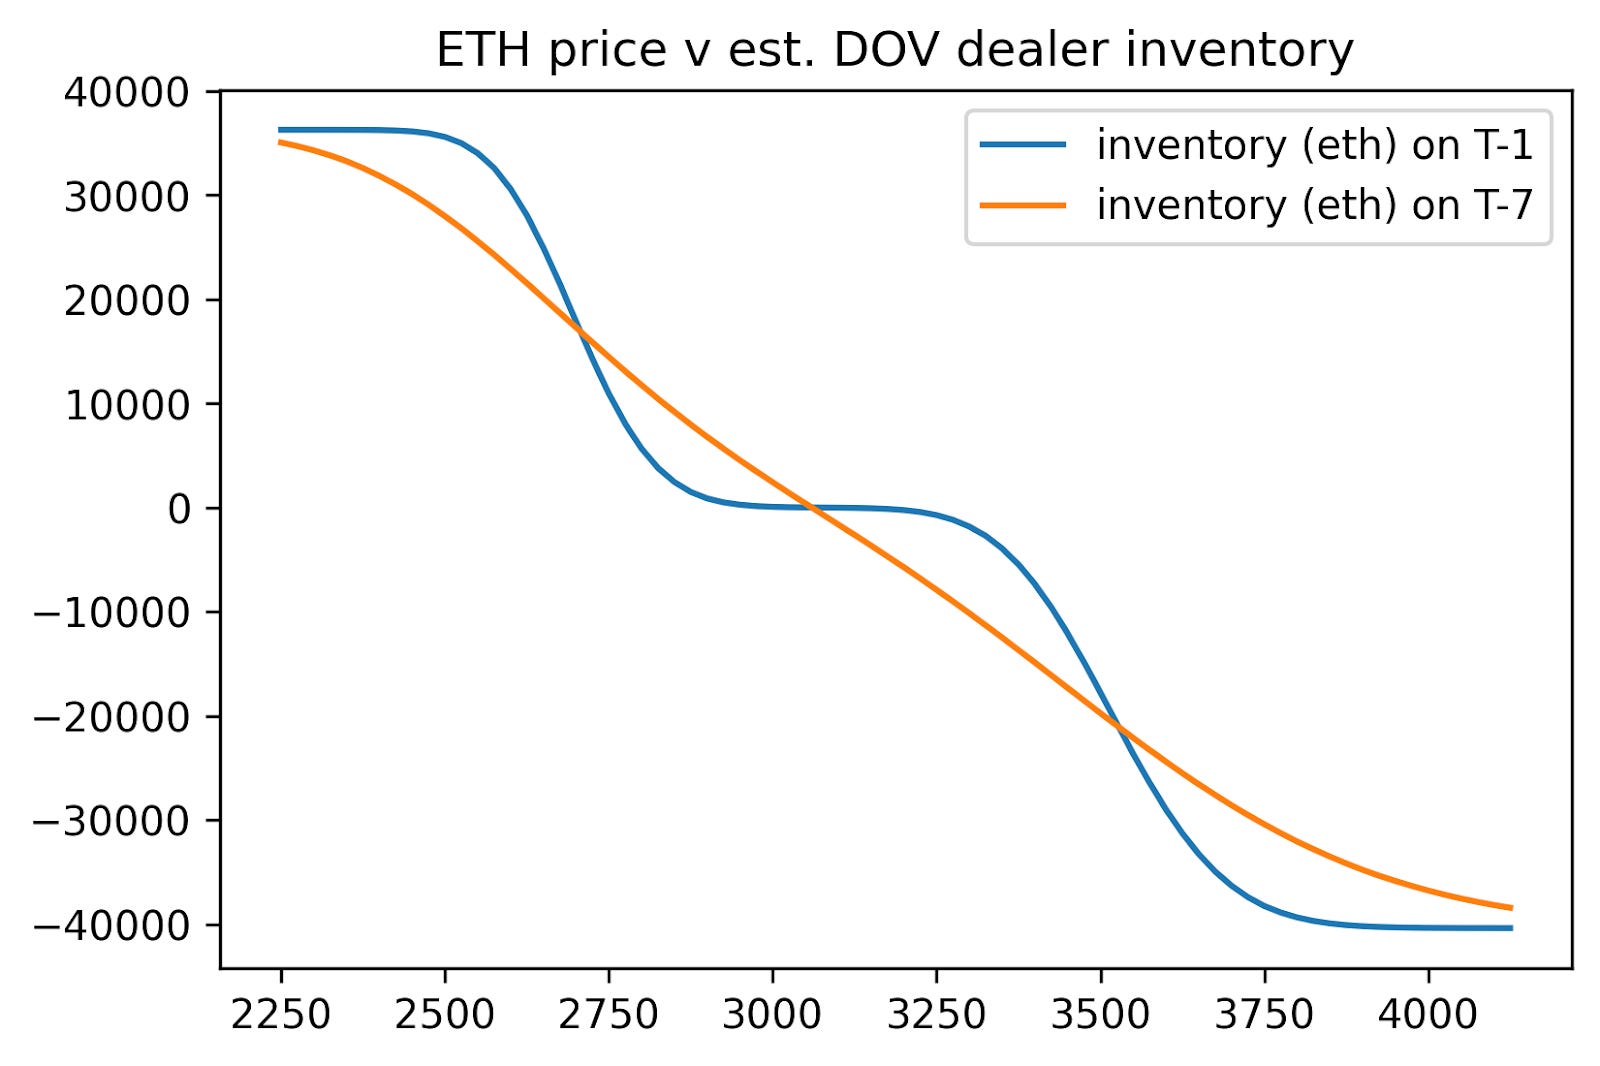
Now the mechanics behind a self-fulfilling spiral of implied down, realized down become clear. If for example Ethereum were to move from $3300 to $3450 the day before the options in this vault expire, market makers would have to sell around $30mn worth of Ethereum futures into that rally. In the absence of other outsized orders, these flows are large enough to put the brakes on a market otherwise floating upwards. QCP thinks so as well.

Now, notice the sharper curves in the dealer inventory estimate on the day before expiry… the rate of change of an option’s delta is called gamma, which is highest at the money. Gamma also increases as expiry approaches. It looks like this:

Which means as expiry approaches, this dampening effect is greatest near the strikes of the options sold that week. If price is near one of these strikes, there is a greater than usual chance that price may be ‘pinned’ near the strike, as market makers sell futures into rallies and buy futures into sell offs.
We can see that in the above case, we estimate that at $2700 close to 3000 Ethereum would have to be bought/sold against just a $20 move in the underlying. These are significant numbers. Of course, all market makers hedge delta differently, so the units here are only an attempt to standardize their impact. In reality, desks may adjust delta hedges more, or far less often than every $20 move in Ethereum.
For the first time, the actual scope of these new DOV effects on underlying flows has been modeled, and it appears worth knowing of in the event that price moves near one of the sold strikes. I will post updates on Twitter when I believe the ‘DOV effect’ is in play to an important degree.
Just as how the massive options flows in traditional finance act as a brake or accelerant on the S&P500, these new systematic flows in crypto, albeit to a lesser extent, are likely to dampen underlying price action going forward.
Liquidity, Returns, and Patterns
This part of the article explores the current state of the market by looking at select metrics from various perspectives (spot & futures). We’ll see how range-capped orderbook liquidity by side (bids/asks) can be indicative of local bottoms & periods of distribution. Furthermore, we’ll explore market-wide returns on a weekly-basis. Using price-action matching, we’ll also see forecasts from a historically similar period. Finally, we’ll see how funding-rate regimes change over time and how they can be indicative of oversold/overbought conditions.
Spot
Fig. 1 shows how BTC’s bid & ask liquidity within 20% of spot-price (Binance) evolved over time. At the end of 2020, the bid & ask liquidity within that range each totaled around $100M. As price rose to ATHs in April, so did the liquidity (~$300M on each side). By the end of July, the peak in liquidity occurred on the bid-side, marking the bottom at the time. Since then, liquidity has been receding despite new ATHs in November ’21. As one can see, spikes in bid-liquidity tend to mark local bottoms. The arrows highlight periods in which asks were rising at the expense of bids, often leading to a local/distribution top. As of the latest update, asks are yet again rising at the expense of bids, indicating the possibility of another distribution. However, note how price can still appreciate for several weeks before the pattern concludes.

Fig. 2 Shows how market-wide weekly cumulative returns indicate the liveliness of the overall market. Using the median across all pairs (bottom part of the chart), 5 periods can be identified in which the return was approximately 20%. The weeks that followed didn’t nearly give as high returns and are more likely to result in negative returns. If we compare the period of July & August to the past few weeks, we can see how the latter’s returns across the market have been much higher in a shorter period of time (more intense red spots on the heatmap).

Fig. 3 Shows how matching historically similar price-action (fractal) can be used to forecast future price-action. The matches aren’t always perfect and should not be taken literally. But like Fig. 1 suggested, it also finds a precedent for a period of distribution that could still result in slightly higher prices before an eventual drop.

Futures
As discussed in the last article, the extended period of mostly negative funding-rates across the market hinted at a regime change in early February. Fig. 4 shows how that regime changed from mostly negative funding- to mostly neutral funding-rates alongside a hike in BTC’s spot price. However, as can be seen, tops in this metric are defined by mostly positive funding across the market. This condition is not yet met, but one could argue that it may not happen, given the geopolitical tensions & tight monetary policy.

Conclusion
Using select metrics from various aspects of the market, we can make more informed decisions. The range-capped orderbook liquidity suggests we may be going through a phase of distribution, as indicated by the rise in ask liquidity at the expense of bid liquidity. The market-wide returns show how most coins have outperformed the July/August period in less time (as indicated by more intense red spots on the heatmap). The fractal forecast, while not always perfect, also suggests a period of consolidation, followed by a period of negative returns. Finally, the market-wide funding-rates indicated a regime change from mostly negative to mostly neutral but does not yet signal mostly positive funding-rates, which would be characteristic of a top. However, given the current geopolitical tensions & tight monetary policy, it’s possible the market won’t achieve mostly positive rates by the time BTC tops.
Sources
[1] Mtrl_Scientist, “Material Indicators.” https://materialindicators.com/ (accessed Jan. 26, 2022).
 |
|