

Coinvexity 21
With 2023 off to a good start (YTD: BTC +38%, ETH +30%), all focus will be on the FOMC interest rate decision today.

Futures

Sentiment continues to ring bullish with BTC posting increasingly positive basis across the board. Whilst the outlook doesn’t scream that BTC is moon-bound, it certainly shows that market participants are bidding up BTC at a higher rate than a couple weeks ago when the Jun futures were barely averaging 0.5% basis and Deribit futures remaining roughly flat through to eoy.

The story in ETH mirrors the overarching ‘thinning grey clouds’ forecast in BTC. Futures here have a positive lean but still remain modest in terms of overall levels.
BTC Perp Funding
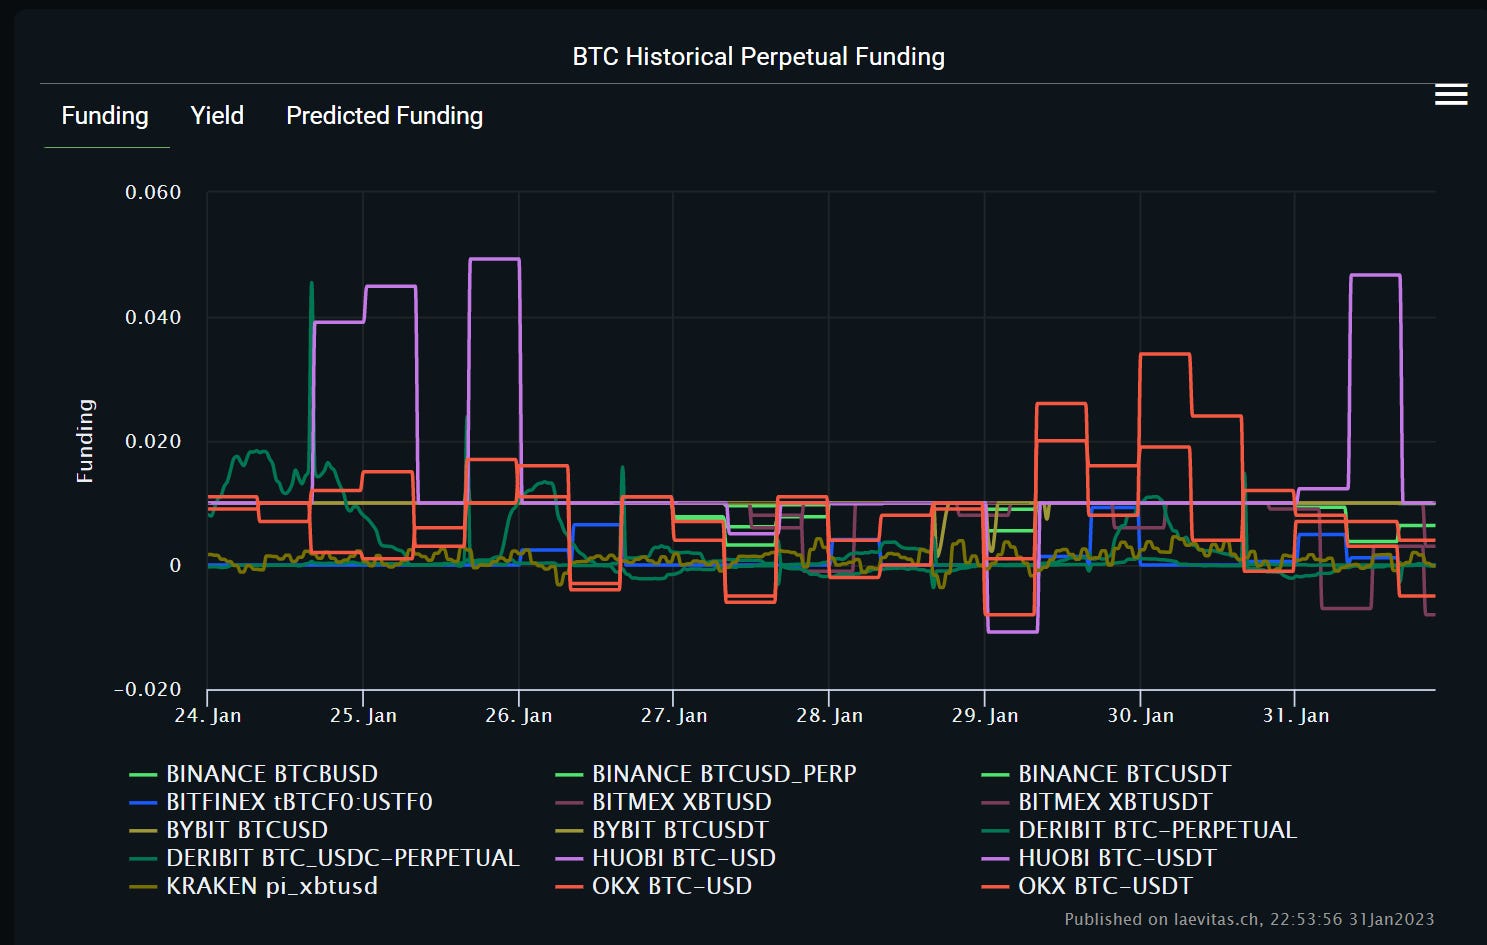
As a side note, funding in BTC has stayed largely positive for the last week of Jan with a few, short-lived forays into negative territory. This reflects the clear bias for long perp positioning, allowing traders to capitalise on the last two week’s rallies.
Vol

Implieds have woken up with weeklies posting a recovery from 47vol lows on 28 Jan. 1wk IV has torn away from the rest of the pack and now prints at 63vol. With a week of economic releases ahead, we will keep a close eye on whether vol dies down or assumes a new regime if the wider economic outlook shifts away from that of tightening and constrictive policies. Prior to 29 Jan, 1mo moved in lockstep with 1wk, but with the 1wk now capturing the upcoming releases the 1mo-1wk spread may prove an enticing play should price action fail to move aggressively post releases.
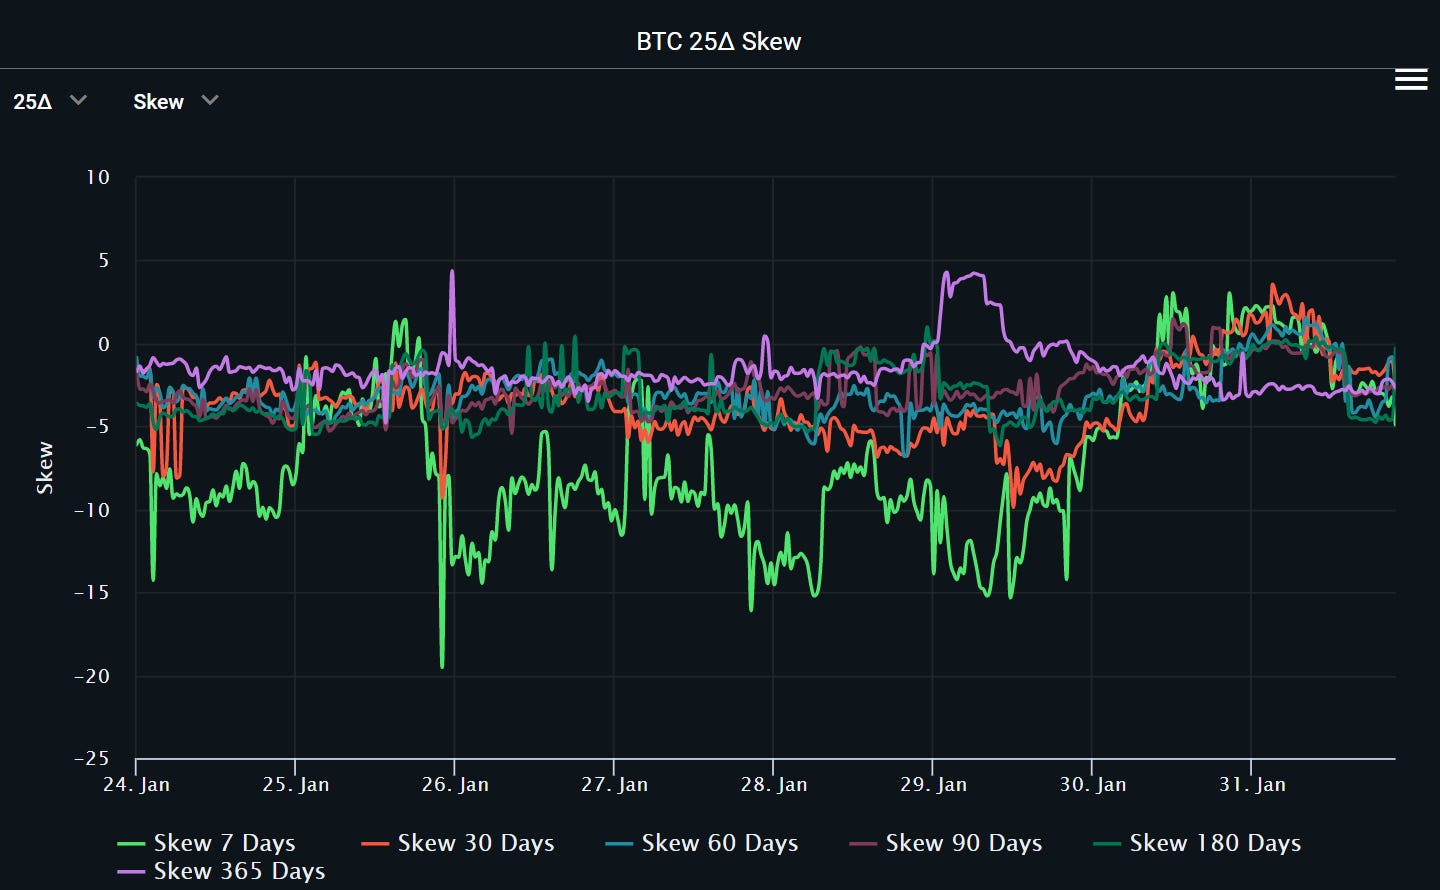
The euphoria captured in 1wk ATM IV isn’t reflected in a directional bias in the skew. If anything, perhaps with skew printing circa 0, the reduced fervent demand for topside has led to Put IV seemingly catching up? Perhaps the market is taking a breather? Regardless, skew still sits marginally in favour of Calls and as above, if the economic outlook turns rosy, we fully expect prints here to swing lower.

The transformation of BTC’s term structure continues. In addition to the term structure clearly pricing in event risk at the near end, the absolute level of IV has also increased drastically from 45vol to 70vol in the space of 3 weeks, roughly since trading resumed in the new year. From Mar23 to eoy the curve remains relatively flat and featureless.

Whilst ETH 1wk ATM IV is still higher than BTC in absolute terms, it hasn’t sprung higher and is seemingly lagging. Vols here have contracted across all tenors with a distribution of around 9vol. If ETH is to follow BTC, you may expect the near term event risk to priced in more aggressively with the 1wk continuing its push through1yr vols.

Interestingly, this spread shows that BTC vol is beginning to encroach on ETH, pushing levels back down to parity. Historically, prints below zero have been short lived and have resulted in ETH regaining its perch soon after. With the release of our new Spread Tool, users will be able to accurately calculate statistics on spreads across many different assets. Keep a close eye on Twitter for details on this exciting release.

The skew in ETH has been less biased than BTC with price action showing the 1wk oscillating around parity along with the 1mo. Whereas the skew in BTC clearly exhibited clear biases towards upside (Call buying), it would seem that demand for downside in ETH remains very much at the forefront of people’s minds.
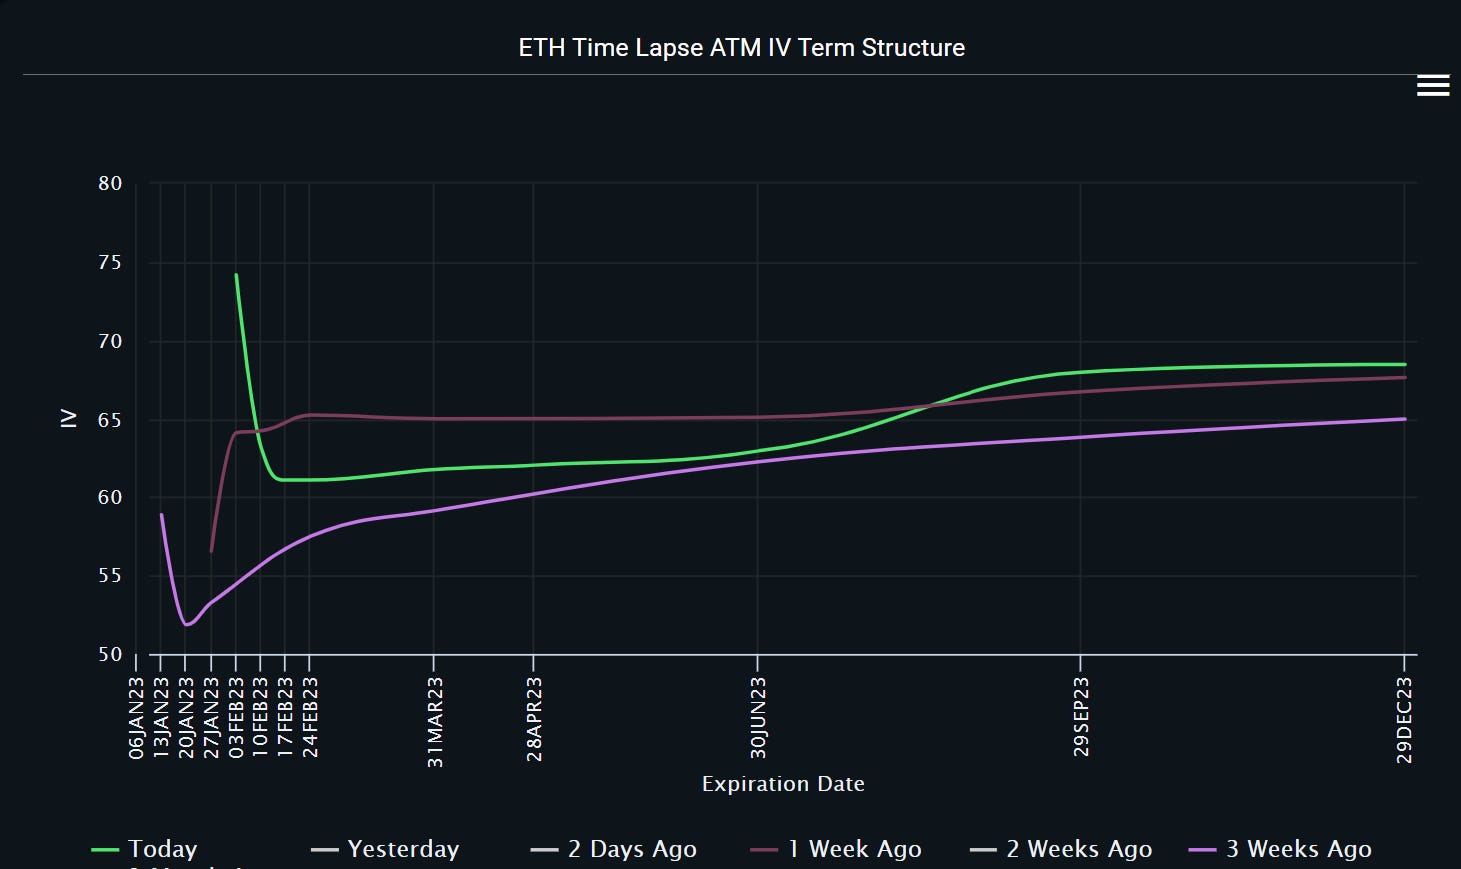
As expected, event risk remains front and centre with the curve capturing early Feb spiking from <60vol to just shy of 75vol.
Vol Run


In BTC and ETH the 3rd of Feb exhibits increased convexity coupled with riskies moving lower (favouring puts). This suggests that even though Calls may still be in demand, Puts have generally been more sought after over the past week pushing the wings higher (OTM options). Otherwise, ATM vol is down on the week with the curve largely offered.