

Coinvexity 13
After surpassing record open interest ahead of the merge, in this Coinvexity issue we take an in-depth look at the Ethereum options market.


Intro
@SousChef
Anyone following the trade tape over the last few weeks would have seen a seemingly never-ending stream of prints for Eth Flies. As detailed below, the body (Straddle at 3.5k) is sold and the wings (Strangle at 3k & 4k) are bought to mitigate losses on what is in essence a short vol play at heart. Essentially the buyer here collects the maximum payout if spot settles at 3.5k and losses are capped if spot runs away in either direction. There's probably a Long Butterfly payoff diagram out there on the internet, somewhere....

Let's take a step back and survey the lay of the land to see what impact, if any, these trades have had.
The most notable factor here is the utter lack of interest in Put buying, denoting the prevailing upside bias in ETH, perhaps driven by expectations over the ETH merge as well as overall sentiment in the wider crypto space. Despite Sep22 and Mar23 posting an impressive USD +1bn in OI, Dec22 looms over with a noteworthy USD 2bn in OI.

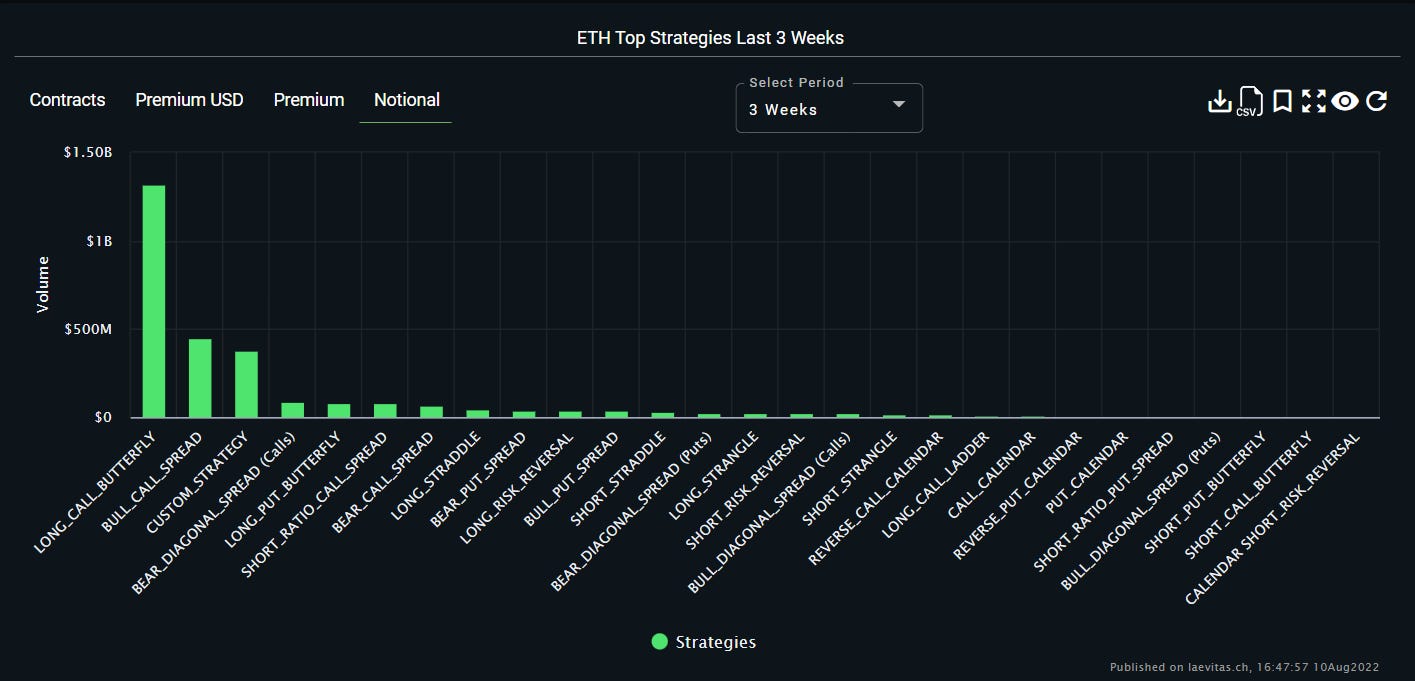
Cracking a level deeper reveals the strike concentration centered around 3.5k. Of note is the apparent shortfall at the 3.5k strike, hinting that whoever made a price in this strategy has begun divesting risk. A quick glance at top ETH strategies suggests this is being done via Call Spreads.

The below chart details OI for Dec22 and Mar23 expiries, showing peaks in volume correlate with a steady climb in OI, suggesting continued accumulation of the prior discussed position.

Such volume would hint at institutional adoption.
In the vol space we continue to see the Sep hump becoming more and more pronounced as the ETH merge narrative continues to play out. BTC on the other hand displays a more traditional curve across the tenor albeit with some near-date risk priced in!!!


ETH Options Orderbook Observations
This section of the current issue of Coinvexity touches on ETH EoY options.
By reconstructing the full orderbook from L2 events, we can observe how the ETH EoY options behave in tandem with the underlying. What follows is a selection of all (almost 80) reconstructed contracts for that expiry.
Fig. 1 shows an out-of-the-money (OTM) put option's orderbook. A few observations:
It was only launched around the height of the June dump and has since been down-only in value. The levels are very coarsely populated, but actively quoted around price, there's hardly any static bids, but static asks (especially when intensity increased) were great for identifying local tops on this contract (which corresponded to local bottoms on the underlying).

Fig. 2 shows a few different interesting features. Maybe the most notable is how the supply wall got lifted a few days before the spot ETH price collapsed, and this contract exploded in value. The supply was then added back at the top, and further supply additions marked the successive local tops in the contract (local bottoms on the underlying). The bid side is much weaker in comparison. Also note how this contract has been available for longer and is more liquid.

Fig. 3 has also been available for a little longer and shows how a massive sell wall has entered the book at the beginning of the month at 9AM UTC, aligning with business hours and suggesting an institutional trade. Some liquidity was pulled shortly before the underlying's dump, but was promptly added a little higher. The very moment it was pulled again marked the top in the contract's price and the bottom on the underlying. Also note the static bids appearing afterwards, matching local bottoms and presumably being TPs for that sell.

As we go further into the money (ITM), asks on the put options start to disappear (Fig. 4). Here, we only see lots of (trailing) bids, that chase the contract's price to 6x of the lowest point, culminating in a large ask wall and reduced quoting activity.

Fig. 5 shows this even more clearly. Once the contract price leaves the 'fair price' area, market makers stop quoting the contract (BBO flatlines) and no asks are present.
On the call side (Fig. 6) we also see a large supply entering the books as the underlying tops in February & April. Long-standing bids are present, but do little to catch price.

Something similar can be observed in Fig. 7. A large supply entered the book just before the big drop of the underlying in early April. The few static bids did little to catch price.

The further we go out of the money on calls (Fig. 8), the better quoting you see immediately around price. However, there's much more trailing asks than there are bids. Furthermore, some static asks yet again corresponded to local tops on the contract & the underlying.

Discussion
Deep OTM puts & calls are actively quoted, but are quickly down-only in value, especially if they were launched during a crash of the underlying, which also means they have poor liquidity. Lifting large offers on OTM puts can be indicative of a pending market crash, as MMers try to avoid selling too early. Static & intense local offers on OTM puts can be indicative of the contracts' local tops, corresponding to the underlying's bottoms. The appearance of large gradient-like walls that align with business hours can be indicative of institutional positioning. The disappearance of such a wall on one of the put contracts coincided with the contract's top and therefore the underlying's bottom. Deep ITM puts tend to not have many offers, and can sometimes be seen with trailing bids. The further ITM those puts go, the worse the ask-liquidity. Eventually, market makers stop quoting altogether. Large gradient-like walls also appear on the call-side and often coincide with local tops. As with puts, the further ITM you go on calls (not shown here), the worse the quoting, though the liquidity isn't as badly balanced.
Conclusion
Reconstructed Deribit orderbooks are also a source for directional plays on the underlying. Though you must be mindful of the differences in liquidity & quoting activity the further ITM/OTM you go. ITM contracts on this expiry are poorly quoted, whereas OTM contracts are well quoted (provided the contract has been live for a long time), but quickly decay. Given the low noise, even the presence of potentially institutional activities can be detected and used to one's advantage. Large static & momentaneous orders are helpful in identifying local bottoms & tops on the contracts & the underlying.
Sources
[1] Mtrl_Scientist, “Material Indicators.” https://materialindicators.com/ (accessed Aug. 07, 2022).