

Coinvexity 12
After one of the most difficult months for the crypto market, July has seen much needed relief. While some metrics are pointing towards returning optimism, another Fed rate hike is expected next week.


Intro
@SousChef

OI by Put/Call in BTC (USD Notional) remains relatively balanced through the near end with Calls only marginally edging ahead. Comparative OI across tenors already shows Sep & Dec volumes are elevated, almost cresting eom levels. 2 interesting points to watch out for are overall notional open interest and also Put/Call ratio. Even if we see a further dip in the near end, we expect calls to continue dominating the landscape here, especially towards eoy.

Interestingly, a rather large clip of eoy Calls were placed within the last 24hrs, a sizeable 33% increase in just one day of trading.

The picture in ETH is far less ambiguous, 'wen moon?' appears to be the setup here. The market wants one thing and apparently wants it in size increasingly so. Sep and Dec alone total USD 2.4bn worth of OI. No doubt the forthcoming merge (Ethereum mainnet merging with its proof-of-stake consensus layer) is driving demand here as many anticipate increased throughput and efficiencies in ETH.

And because we're all fully in agreement that the fate of the market can be faultlessly garnered from 3 hastily drawn lines, a quick glance at BTC price action suggests potential resistance around the 27k then May/June's congestion in the 31/32k region. If that is vaulted, 40k comes well and truly into the picture otherwise we have to look for the interaction with the descending trendline from Nov 21 *Places crystal ball back in holster.*

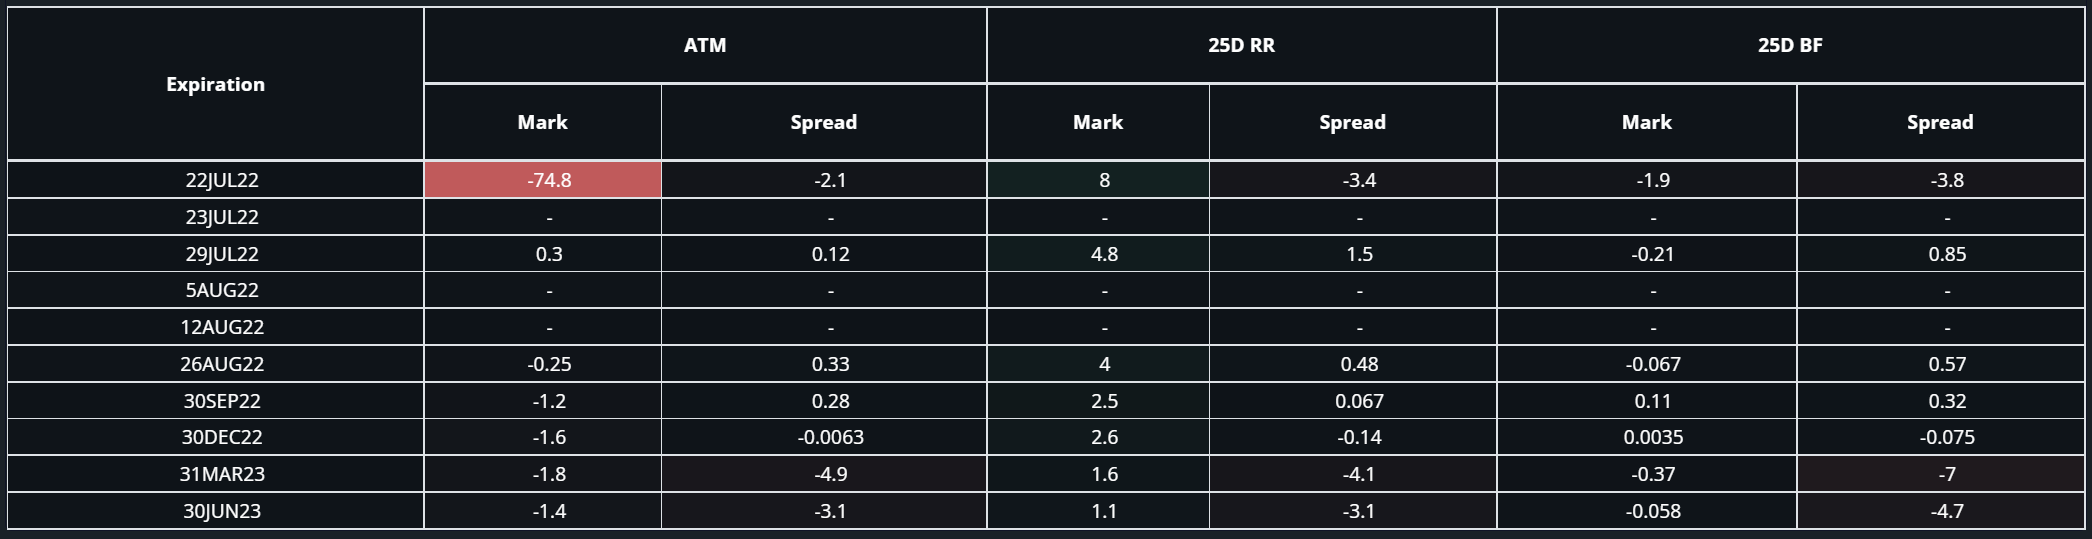
BTC 2wk change in mark/spread shows that as spot rises, vol is coming off coupled with backend spreads also narrowing. 25D RR shows skew shifting in favour of calls across the curve and Flies highlight marginally reduced convexity.
ETH more or less mimics BTC as Riskies show considerable bias towards Calls, printing close to a 10% gain in 2wks. Whereas Flies remain somewhat modest, posting negligible change over the course.
Bullwhip
This section of the current issue of Coinvexity touches on rate hikes and the macro outlook.
Macro
The last issue mentions how the market expects rate cuts at the end of '22 or early '23. However, the ED- & FF- futures curves also show how the market prices in a continuation of hiking in late '24 - mid '25.

This alternating period of QE/QT ties in with what Michael Burry refers to as 'Bullwhip' effect (Fig. 2).


As seen in Fig. 2, Burry argues that there'll be a Christmas in July due to retailers (like Target & Walmart) having too much inventory which they'll need to get rid of at fire-sale prices, creating disinflationary pressure. Hence, 'Christmas in July'. Furthermore, he argues that the FED will have no choice but to revert their stance on hikes (which is what the implied rates show). A reversion from QT back to QE would spur demand, but once again put pressure on the supply chains. This will then require another round of QT to curb demand (as the implied rates anticipate). To make matters worse, a small change in demand can propagate upstream and cause further misallocations as suppliers try to satisfy the demand, creating a whip-like effect on demand/supply imbalance. Incidentally, this also reflected the SPX PA back in the '70s, the last period of stagflation - a series of higher highs & lower lows.
As such, a bullwhip would create increasingly more volatile price action, but would ultimately lead to a net 0% change in asset prices over many years (as was the case in the '70s, Fig. 3).

Conclusion
ED- & FF futures imply rate cuts around the start of '23, which aligns with Burry's thesis that the FED will have to revert their stance on hikes. However, ensuing QE, while restoring demand, would put additional stress on the supply chain, propagating misallocations upstream and creating a whip-like effect. As a result, PA might become increasingly more volatile, but end at a similar level in a few years as it started. Therefore, the resulting PA might be more favorable to traders rather than investors.
Sources
[1] Mtrl_Scientist, “Material Indicators.” https://materialindicators.com/ (accessed Jul. 22, 2022).
[2] Casgains Academy “Michael Burry: EVERYONE Will Be Terrified in 21 Days” Jul 11, 2022. https://www.youtube.com/watch?v=AYObaBrpZkA (accessed Jul 22, 2022).
[3] Jurrien Timmer, https://twitter.com/TimmerFidelity/status/1540676320765558785?s=20&t=FEn7ctubxjjFYioHd5ozqA (accessed Jul. 22, 2022).